
Process Fundamentals
PET preforms, blow-molding fundamentals, equipment parameters and changeover procedures.

Hands-on PET manufacturing training meets advanced process science. D.E.L.L. PET and strategic technical partner Steve Zagarola of NWCPE help manufacturing teams understand their processes, solve complex problems, and sustain improvements.
PET preforms, blow-molding fundamentals, equipment parameters and changeover procedures.
Connect symptoms with production evidence and turn recurring issues into deeper process knowledge.
Review data, validate changes, document learning and hold the gains over time.

PET Container Engineering & Manufacturing Process Specialist · B.S., Mechanical Engineering, Georgia Tech · Executive Master Black Belt
Steve helped develop the first PET bottle designs at The Coca-Cola Company, is an inventor on the first commercial 2-liter PET bottle patent, and authored Coca-Cola’s original PET performance specifications and test methods.
Through the D.E.L.L. PET and NWCPE strategic partnership, manufacturers can access his foundational PET knowledge and specialized DOE, SPC, quality system and technical coaching capabilities.
DOE identifies factors and interactions that drive performance. SPC helps teams understand variation and maintain control.
DOE is a structured statistical method for understanding and improving processes. By systematically varying key process variables, DOE identifies the factors and interactions that drive performance and produces predictive models.
These models accelerate startup optimization, solve complex problems, and improve yield and quality. The practice of DOE fosters collaboration among operators, technicians, and engineers, building process knowledge, teamwork, creating a sense of ownership and pride in sustainable results.
Examples from Steve’s presentation. Plotted settings and values belong to these examples.
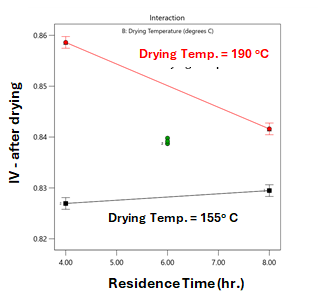 Open full-size chart (opens in a new tab)
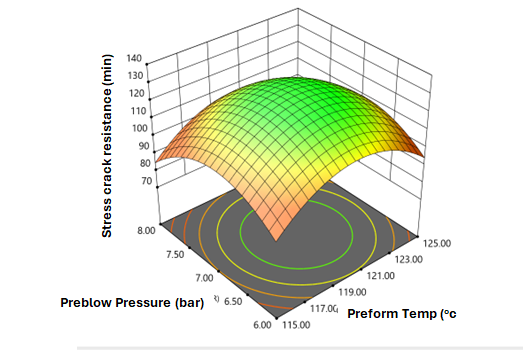 Open full-size chart (opens in a new tab)
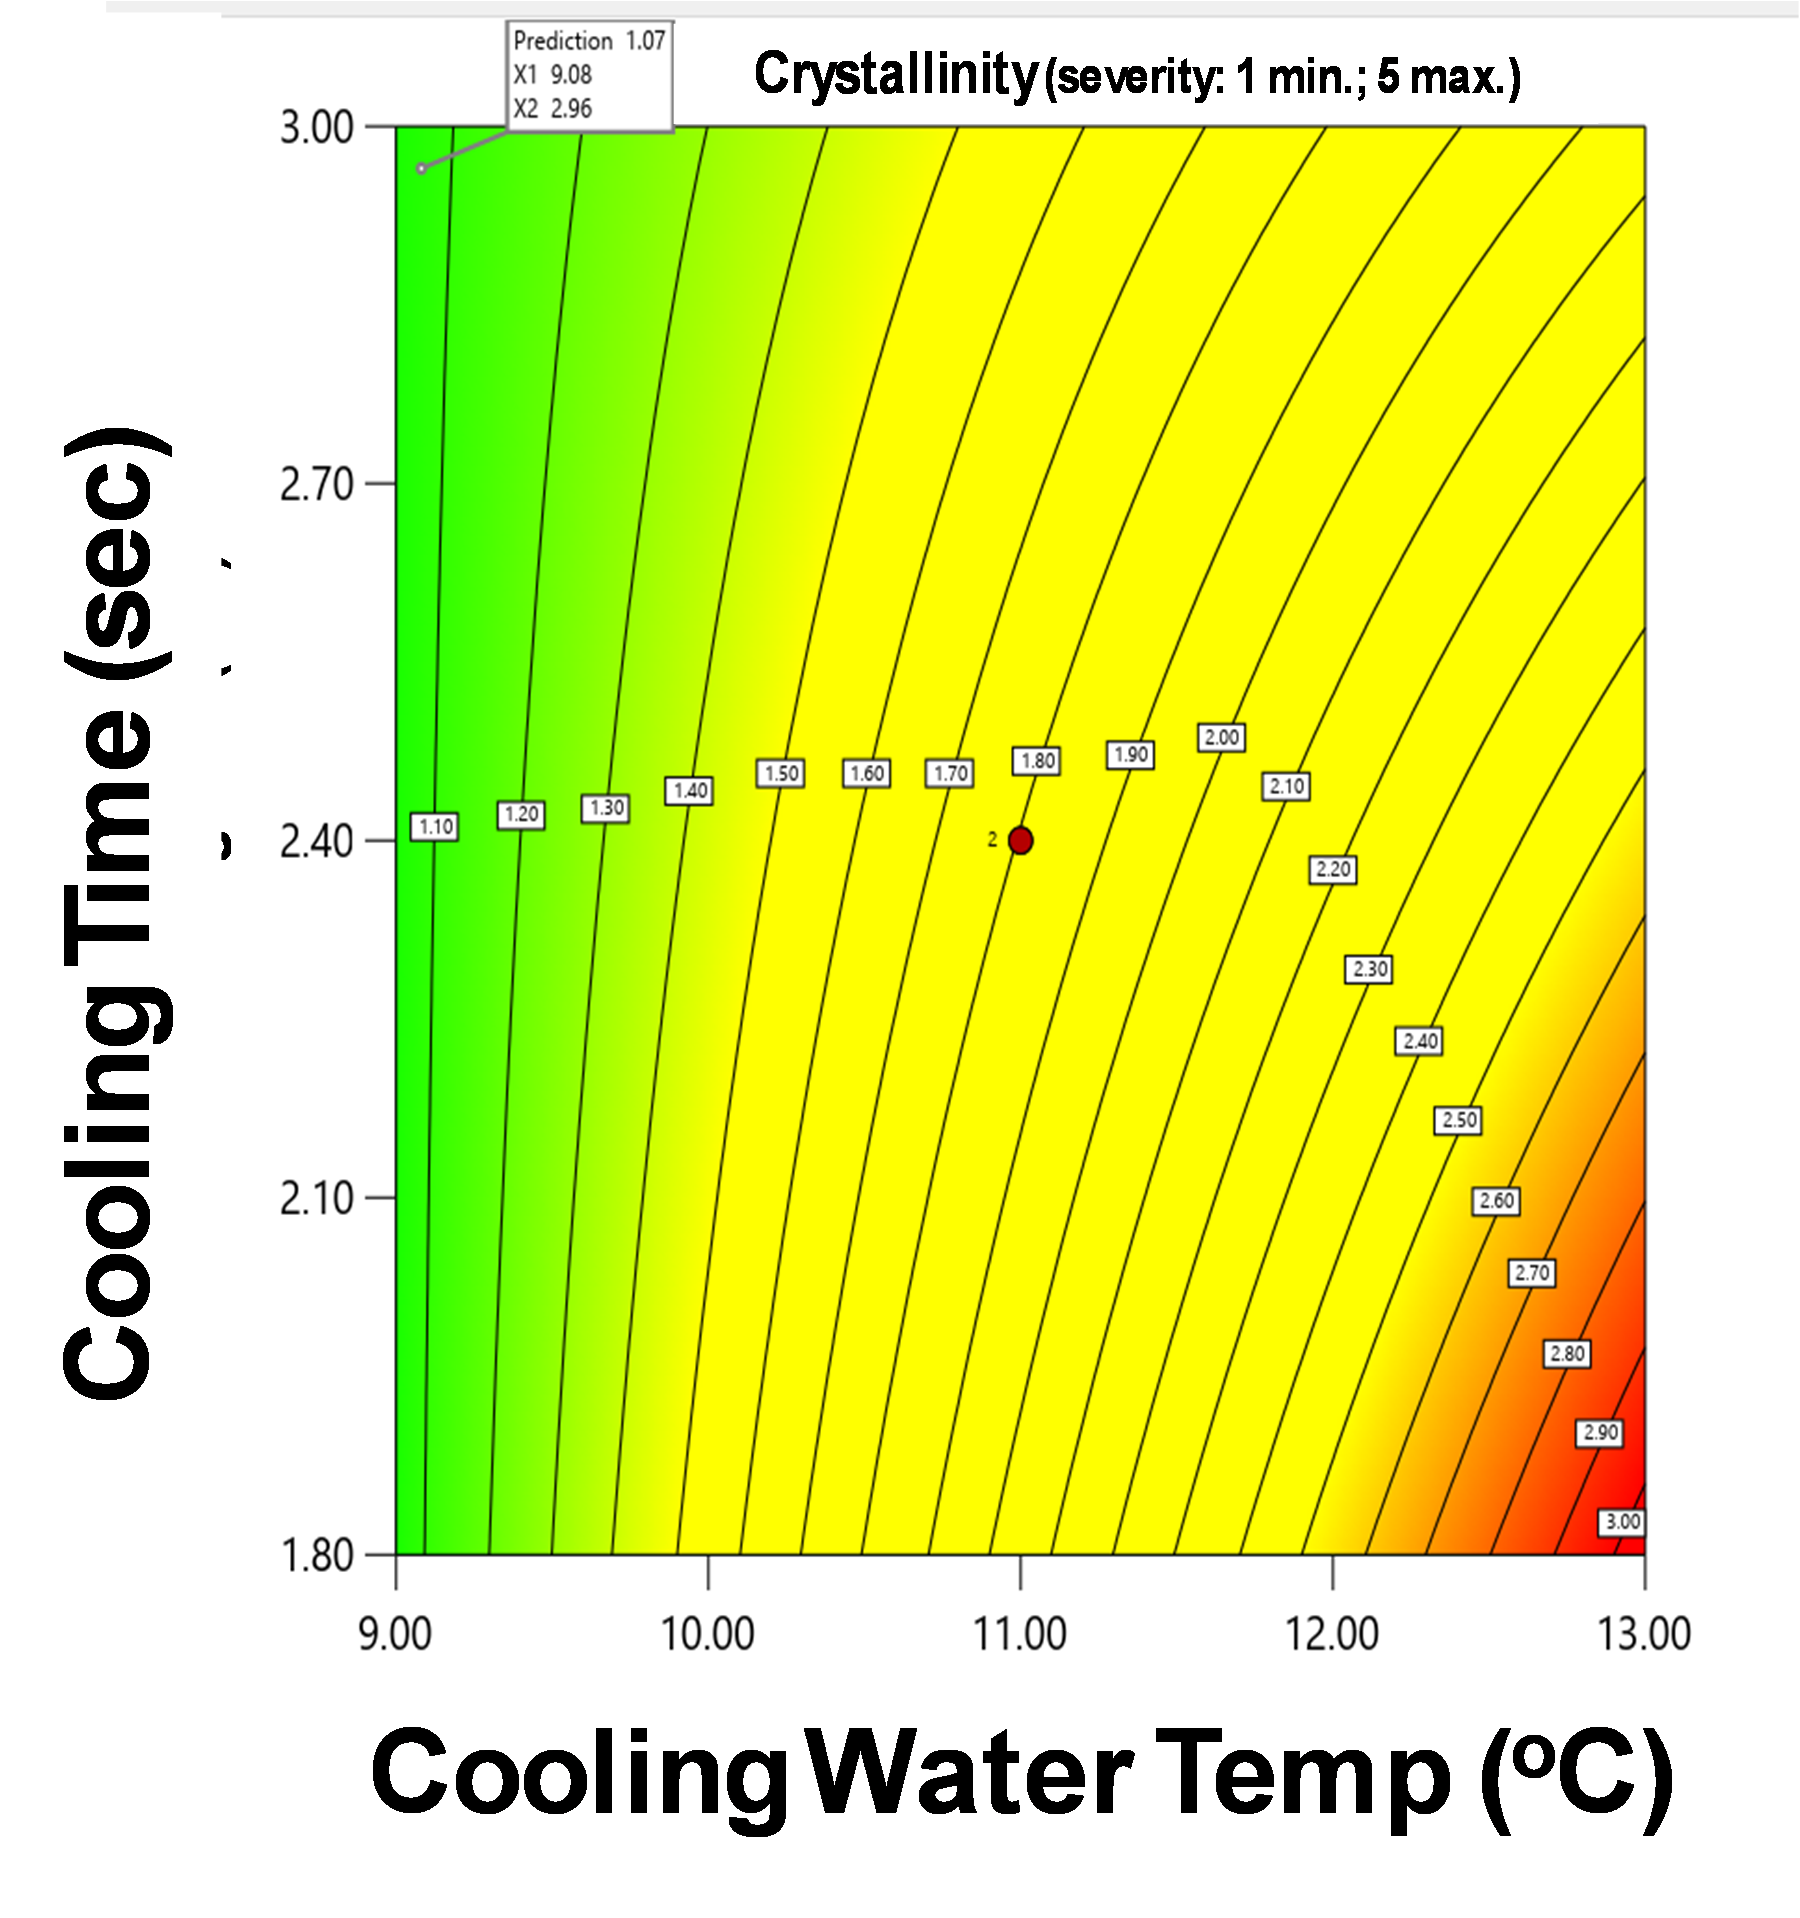 Open full-size chart (opens in a new tab)
Statistical Process Control helps teams monitor process variation, distinguish routine fluctuations from meaningful process shifts, and maintain consistent operations once improvements have been implemented.
Examples from Steve’s presentation. Plotted settings and values belong to these examples.
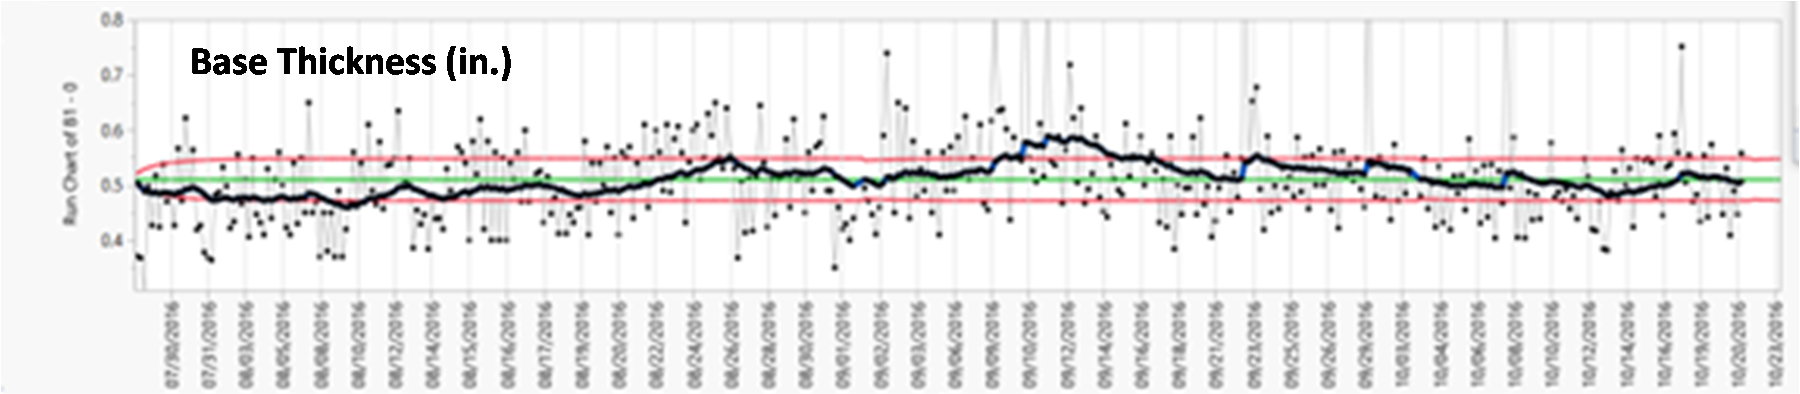 Open full-size chart (opens in a new tab)
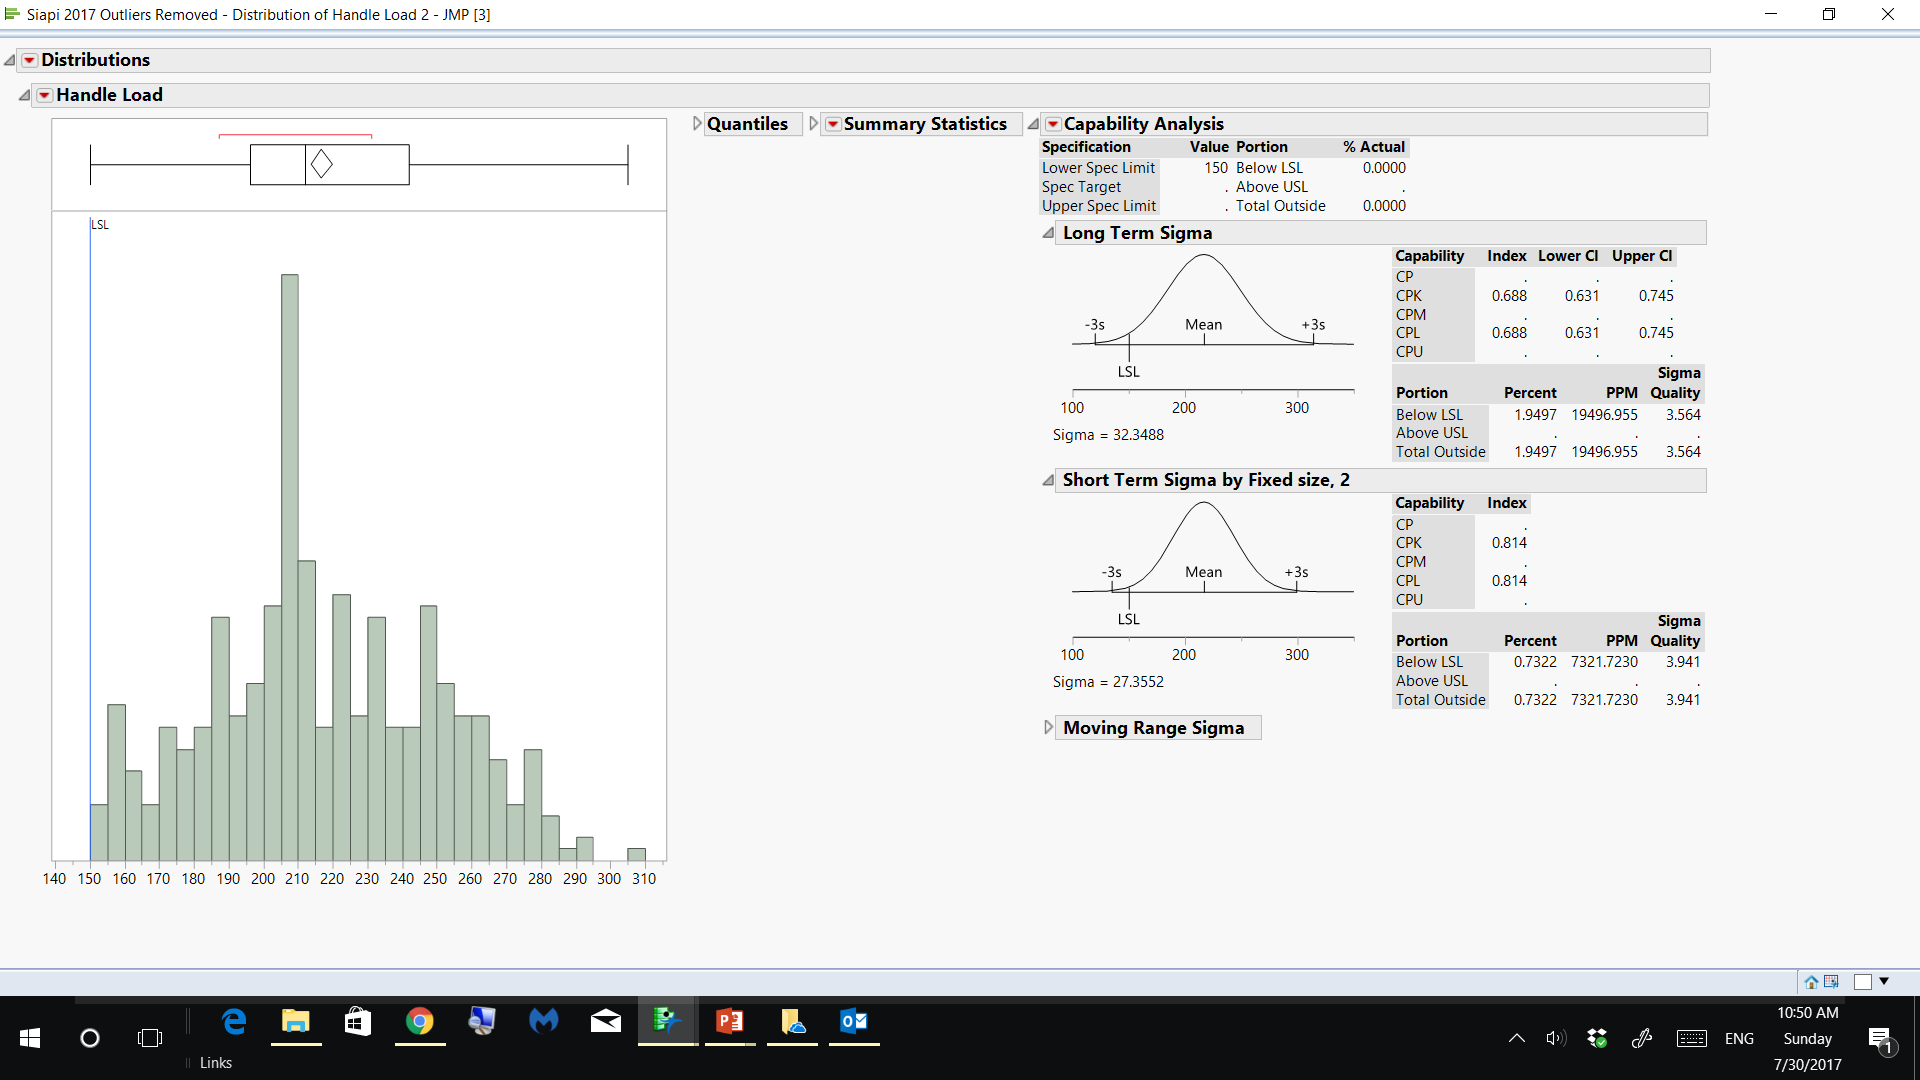 Open full-size chart (opens in a new tab)
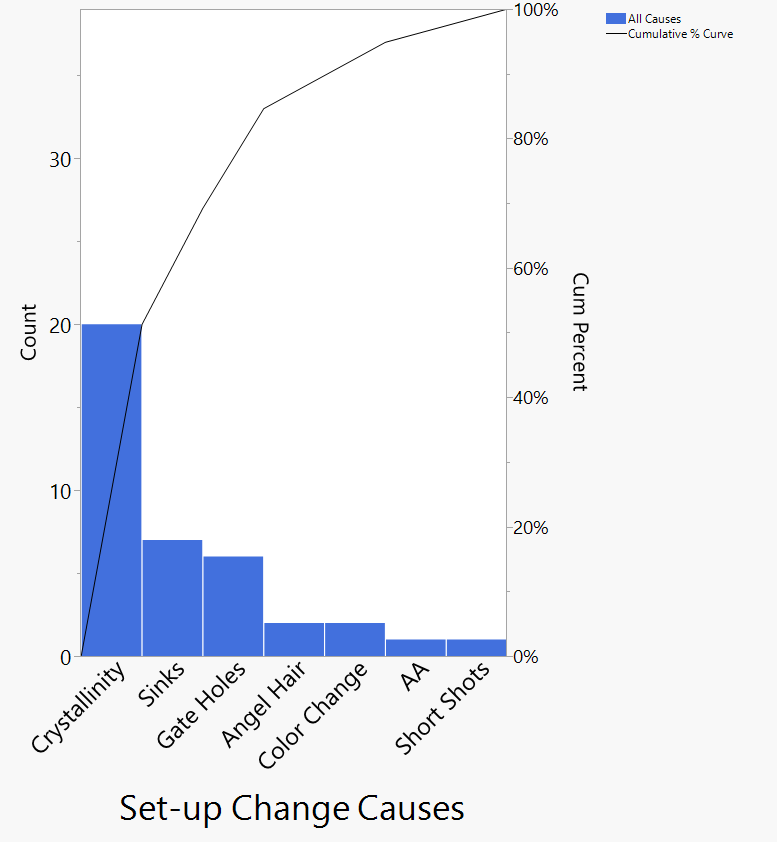 Open full-size chart (opens in a new tab)
Environmental stress crack resistance
AA reduction
IV retention
Defect elimination
Process optimization
Performance engineering
Gas-barrier optimization
Process control and capability
Build process knowledge through practical training, explore the blow cycle, and apply what your team learns on the production floor.
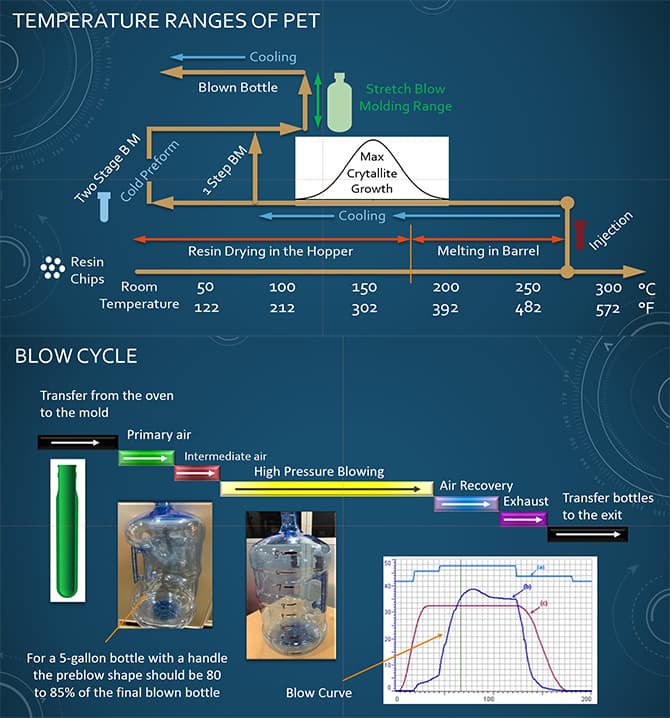
Explore PET temperature ranges, heat, pre-blow pressure, high-pressure blowing and stretch timing.
Explore the interactive blow-molding model →Adjust heat, blow pressure, and stretch timing and watch the wall-thickness distribution respond.
This is a simplified, illustrative model, not engineering-grade simulation. Open the full Interactive Process Guide →
Practical instruction based on equipment, process history and operating conditions.
View Training Service →Review production data, test process changes and sustain measurable operational improvements.
View Program Details →Process reviews, troubleshooting and technical support alongside on-site teams.
View Remote Support →PET manufacturing services, technical support, troubleshooting, training, continuous improvement and project management.
Request PET manufacturing supportSpecialist DOE, SPC, Lean Six Sigma, process assessment and technical coaching support.
Explore NWCPE expertise (opens in a new tab)